I needed to automate the production of several Chart.js charts as images as part of a blog.
These charts are fairly simple bar charts. Additionally, they need to have a ‘complex’ chart title, the format of which Chart.js is unable to handle, as well as a footer.
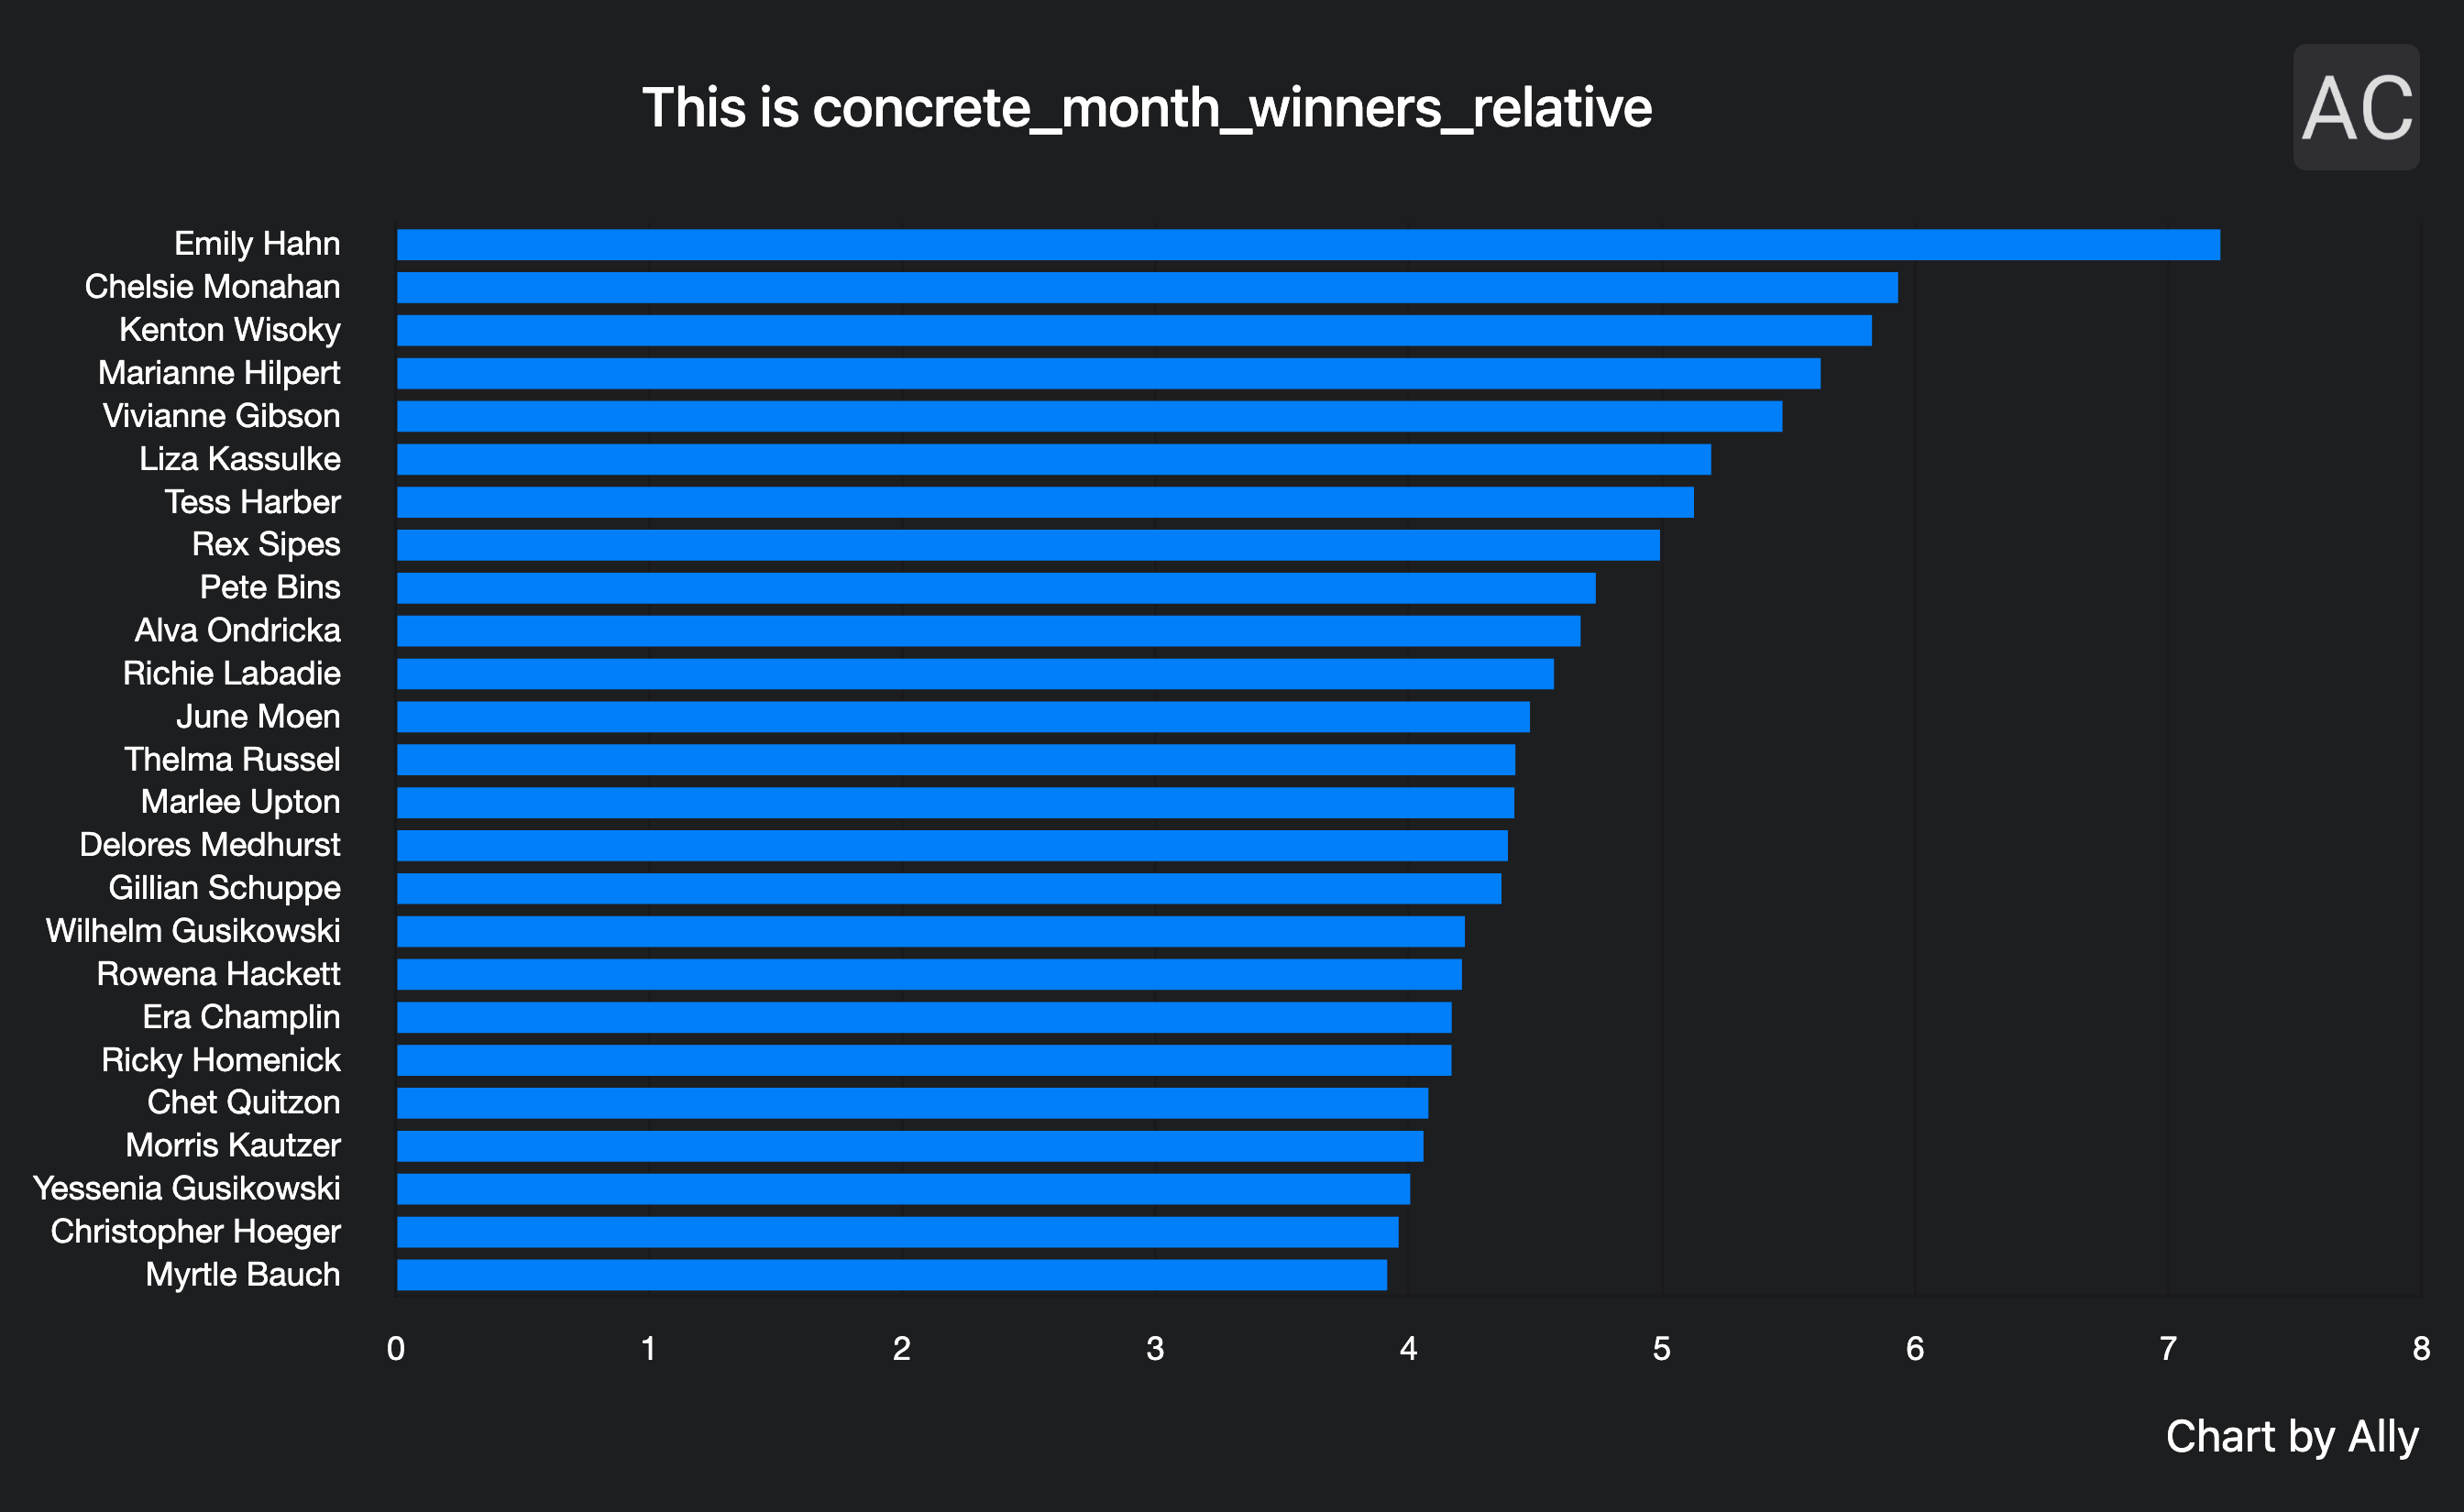
Crisp example of the generated screenshot. Have modified the code in
HorizontalBarChart::toArrayso doesn’t burn dark-mode user’s retinas, you’re welcome.
I use a simple blade layout and chart component to make a simple view for Browsershot to screenshot and then save the result to S3.
The code mentioned is for illustrative purposes and may not be entirely correct and has been annotated.
If you prefer you can see the gists without annotations for:
Layout
Simple layout which has tailwind, chartjs loaded from CDN, and:
- Line 12: a slot for the chart title
- Line 29: a
$chartvariable which will bejson_encodedand passed into chartjs - Line 35: a footer which never changes
resources/views/components/chart-layout.blade.php:
|
|
Chart
Most of the charts will have a fixed number of items, there is a static constructor on a DTO will make the chartjs config object.
<?php

namespace App\Charts;

use Spatie\DataTransferObject\DataTransferObject;
use Illuminate\Support\Collection;

class HorizontalBarChart extends DataTransferObject
{
    public const MEASUREMENT_RELATIVE = 'relative';
    public const MEASUREMENT_ABSOLUTE = 'absolute';

    public const CHART_COLOR_BAR_RELATIVE = '#E46C0A';
    public const CHART_COLOR_BAR_ABSOLUTE = '#8FB4E3';

    public string $color;
    public array $labels;
    public array $data;
The chart will take a collection of DTOs whose implementation detail is not too important.
For context, in my scenario the charts will show changes over month/year and can either show absolute/relative changes, which are encapsulated in a ChartItemDto.
|
|
The chartjs configuration object which will be passed into the layout component will typically look like this.
These charts have a fixed number of items, if there is a variable number, you may come up with suitable values/formulae and set options.aspectRatio (default is 2).
    public function toArray(): array
    {
        return [
            'type' => 'bar',
            'data' => [
                'labels' => $this->labels,
                'datasets' => [
                    [
                        'data' => $this->data,
                        'backgroundColor' => $this->color,
                    ],
                ],
            ],
            'options' => [
                'animation' => false,
                'indexAxis' => 'y',
                'scales' => [
                    'y' => [
                        'ticks' => [
Setting autoSkip to false means that it will not collapse labels, which happens by default and is undesirable in my case since each item’s label is required to be visible.
'autoSkip' => false,
Adding some padding to add some space between the label and the chart.
                            'padding' => 12,
                        ],
                        'grid' => [
Disable the horizontal grid lines.
                            'display' => false,
                        ],
                    ],
                    'x' => [
                        'ticks' => [
I want to add some space between the bottom of the graph, and the item’s value.
                            'padding' => 12,
                        ],
                        'grid' => [
I do not want to draw tick lines below the bottom of the graph.
                            'tickLength' => 0,
                        ],
                    ],
                ],
                'plugins' => [
                    'legend' => [
                        'display' => false,
                    ],
                ],
            ],
        ];
    }
}
See entire gist here.
Chart Generator
I have various charts to generate, they implement the following interface:
Article: the article to which the generated chart belongsAsset: the model which is created as a record of the chart’s attributes and location on S3
<?php

namespace App\Charts\Generators;

use App\Article;
use App\Asset;
use Illuminate\Support\Collection;

interface ChartGenerator
{
    /**
     * Make the chart and save the asset record.
     *
     * @return Asset
     */
    public function png(): Asset;

    /**
     * The article the chart relates to.
     *
     * @param Article $article
     * @return $this
     */
    public function setArticle(Article $article): self;

    /**
     * The article the chart relates to.
     *
     * @return Article
     */
    public function getArticle(): Article;

    /**
     * The name of the file to be saved (excluding extension)
     *
     * @return string
     */
    public function getAssetLocationName(): string;

    /**
     * The trend, i.e. all, winners, losers.
     *
     * @return string
     */
    public function getTrend(): string;

    /**
     * The period, i.e. month, year.
     *
     * @return string
     */
    public function getPeriod(): string;

    /**
     * The measurement, i.e. absolute or relative.
     *
     * @return string
     */
    public function getMeasurement(): string;

    /**
     * The rows of data to create graph from.
     *
     * @return Collection
     */
    public function getRows(): Collection;

    /**
     * The chartjs object.
     *
     * @return array
     */
    public function getChart(): array;

    /**
     * The view file to build from.
     *
     * @return string
     */
    public function getView(): string;

    /**
     * The parameters to include in the view file.
     *
     * @return array
     */
    public function getViewAttributeBag(): array;

    /**
     * The html from the view and view bag for browsershot to use.
     *
     * @return string
     */
    public function html(): string;
}
And some implementation detail:
<?php

namespace App\Charts\Generators;

use Illuminate\Contracts\Filesystem\Filesystem;
use Illuminate\Support\Facades\Storage;
use Spatie\TemporaryDirectory\TemporaryDirectory;

abstract class AbstractChartGenerator implements ChartGenerator
{
    public Article $article;
    public TemporaryDirectory $temp;
    public Filesystem $disk;

    public function __construct()
    {
        $this->temp = (new TemporaryDirectory)->create();
        $this->disk = Storage::createLocalDriver(['root' => $this->temp->path()]);
    }

    public function setArticle(Article $article): self
    {
        $this->article = $article;

        return $this;
    }

    public function getArticle(): Article
    {
        return $this->article;
    }

    public function getViewAttributeBag(): array
    {
        return [
            'chart' => $this->getChart(),
        ];
    }

    public function getChart(): array
    {
        return HorizontalBarChart::make(
            $this->getRows(),
            $this->getMeasurement()
        )->toArray();
    }

    public function html(): string
    {
        return app('view')
            ->make($this->getView(), $this->getViewAttributeBag())
            ->render();
    }
}
Chart Generator Implementation
There are just a few implementation details to finish for each generator.
<?php

namespace App\Charts\Generators;

class ConcreteMonthWinnersRelativeChartGenerator extends AbstractChartGenerator
{
    public function getMediaLocationName(): string
    {
        // TODO: add region/date affixes
        return 'concrete_month_winners_relative';
    }

    public function getMeasurement(): string
    {
        return StatsCollector::MEASUREMENT_RELATIVE;
    }

    public function getRows(): Collection
    {
        return $this->stats->getConcreteMonthWinnersRelativeData();
    }

    public function getView(): string
    {
        return 'charts.concrete_month_winners_relative';
    }

    public function getTrend(): string
    {
        return 'winners';
    }

    public function getPeriod(): string
    {
        return 'month';
    }
View resources/views/charts/concrete_month_winners_relative.blade.php:
<?php /** @var array $chart */ ?>
<x-chart-layout :chart="$chart">
    This is concrete_month_winners_relative
</x-chart-layout>
Screenshotting
Using the html from the interface to take a screenshot is easy.
    public function png(): Asset
    {
        Browsershot::html($this->html())
            ->deviceScaleFactor(3)
- width: 896px - this is the max width of the container in which these images will be placed, i.e. tailwind
max-w-4xl - height: 1px - this makes smaller charts without having whitespace below
            ->windowSize(
                896,
                1
            )
            ->fullPage()
            ->save($this->disk->path($name = $this->getMediaLocationName() . '.png'));

        Storage::disk($driver = 's3')->put(
            $remotePath = sprintf('article_charts/%d/%s', $this->getArticle()->id, $name),
            $this->disk->get($name),
            'public'
        );

        $asset = new Asset();
        $asset->relatable_id = $this->getArticle()->id;
        $asset->relatable_type = $this->getArticle()->getMorphClass();
        $asset->media_location = Storage::disk($driver)->url($remotePath);
        $asset->save();

        // TODO: store the associated meta
        // $this->getTrend()
        // $this->getPeriod()
        // $this->getMeasurement()

        return $asset;
    }
}
See full gist here for illustrative purposes.